Analytics for fashion brands that trade in sizes and seasons.
Size curves, pace against plan, profit after returns and the email designs that earn, joined on one timeline with every change to your store, ads and email.

A range bought months ago, sold day by day.
The curve you bought is not the curve you sell
M and L go first, XS and XL sit, and the next buy repeats the mistake unless someone looks.
Best sellers that come back
A dress that sells well and returns 40% of the time is a different product once the refunds land.
Months that do not trade in straight lines
A slow first week is normal and a slow last week is not; a flat target cannot tell them apart.
Know by the 9th whether the month will land.
A target that follows how the month trades, the gap split into orders, discounts and returns, and a list of lines to push and hold.
See targets and the P&L
The best seller on revenue is not always the best on profit.
Returns, costs and the ads that sold it come off, product by product, and the tiers written to Shopify follow.
See the P&L
See which email designs actually earn.
Every campaign kept as sent and ranked by revenue per recipient, beside your sales.
See email
Built on sizes, stock and seasons.
Size coverage
The share of sizes in stock for every selling line, and the lines with holes in their run.
Sell-through
Units sold against units received, per product and range.
Discount rate and markdown candidates
How deep the month's discounts ran, and the lines the markdown rule flags.
Return rate against the category
Products returning far more than their category, a fit signal worth checking.
Theme publishes
Every new season's theme on the line with the conversion that followed.
Entry products
Which first purchase brings a customer back for a second.
The capabilities fashion brands lead with
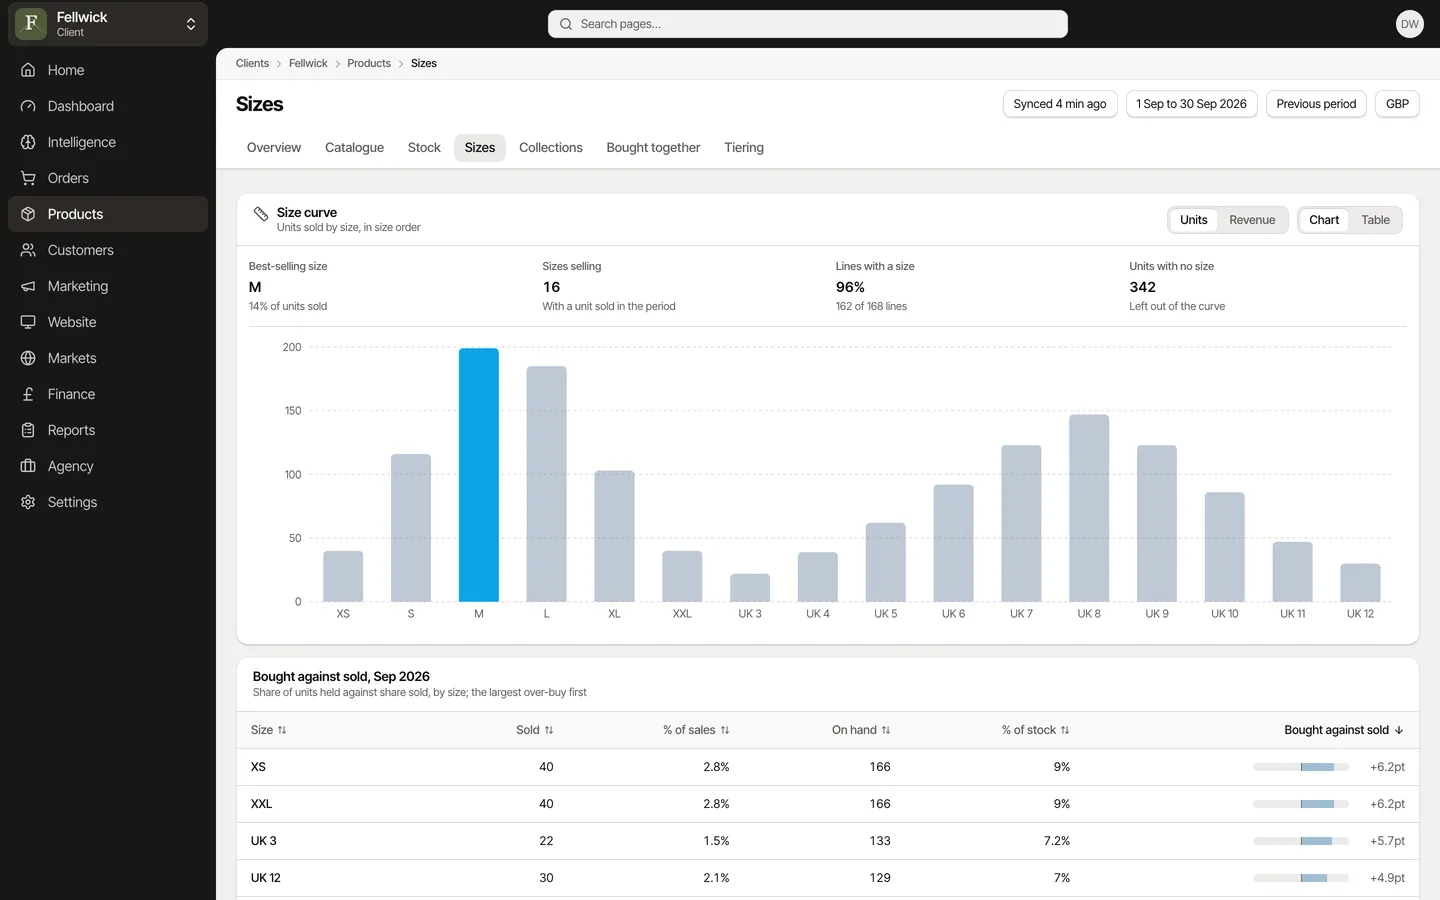
Products
Sell-through, cover and size curves for every line, and what to reorder.
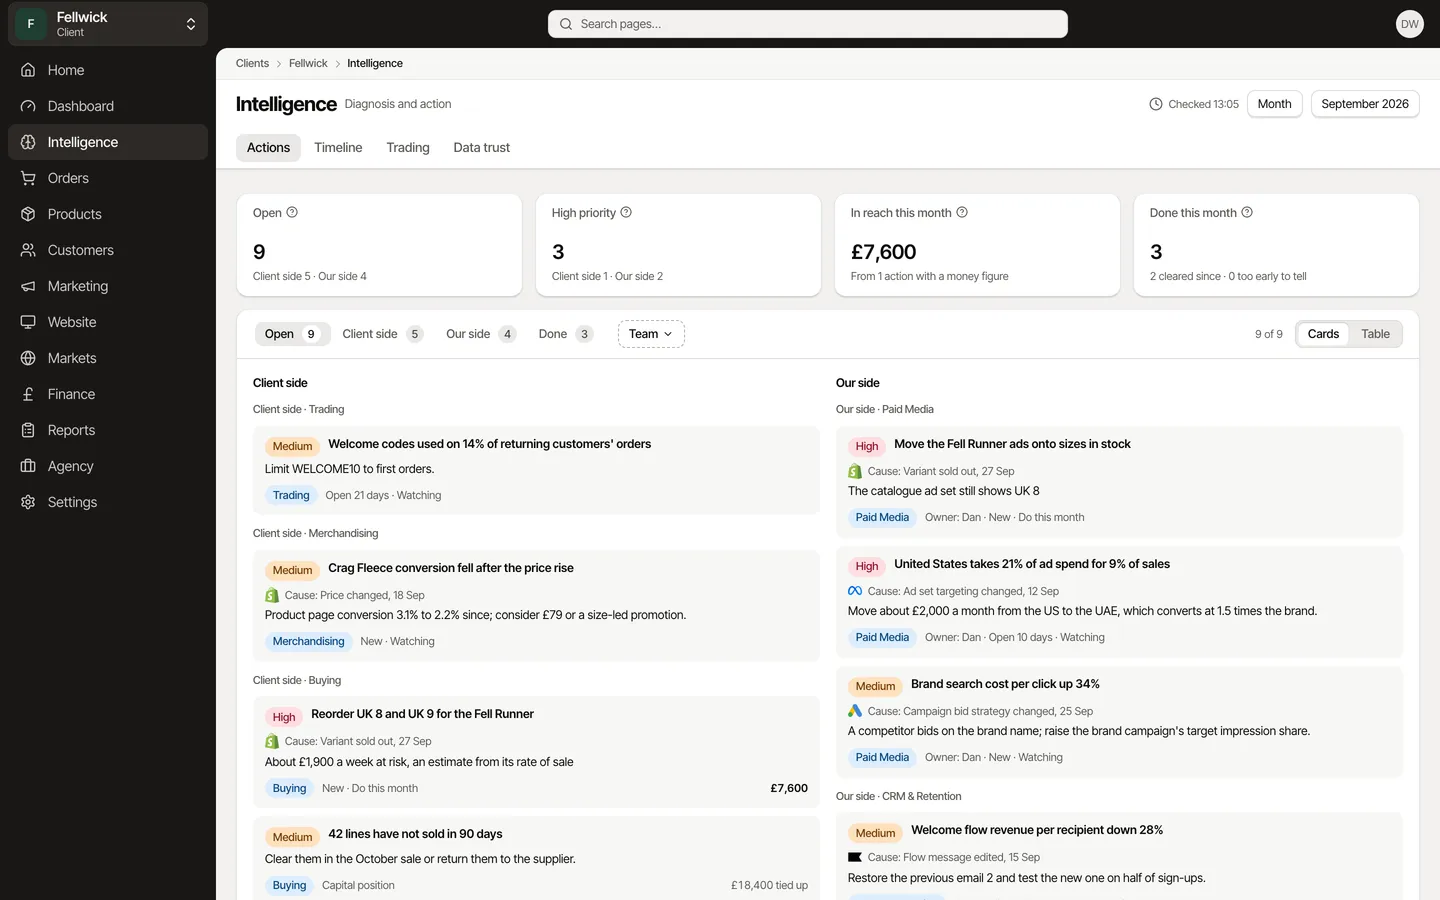
Intelligence
Each team's list every morning, ranked by the money within reach.
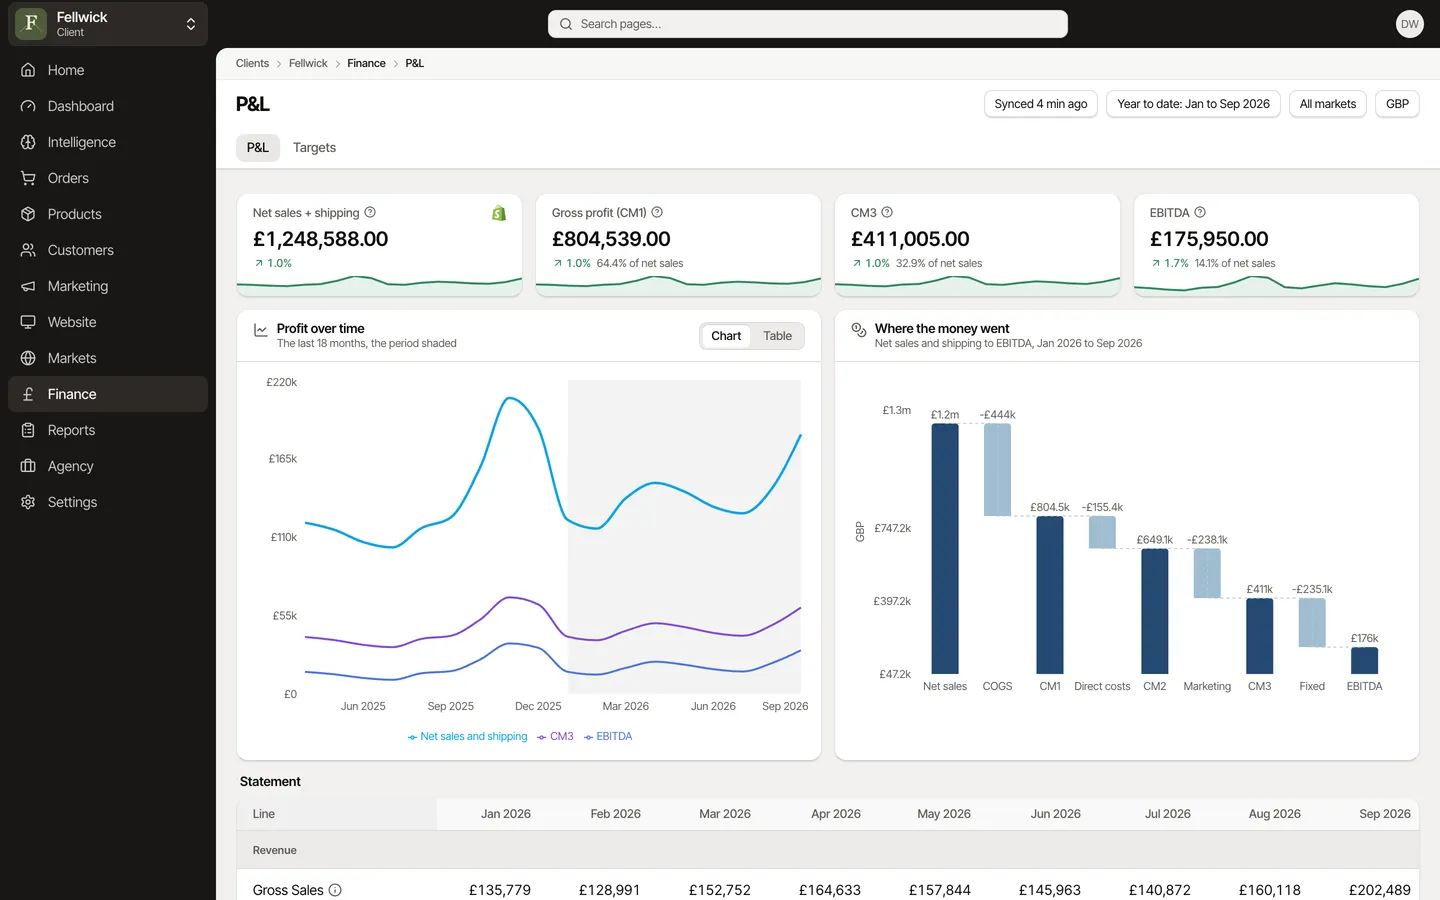
Finance
A real P&L from gross sales to EBITDA, and targets that follow how your year trades.
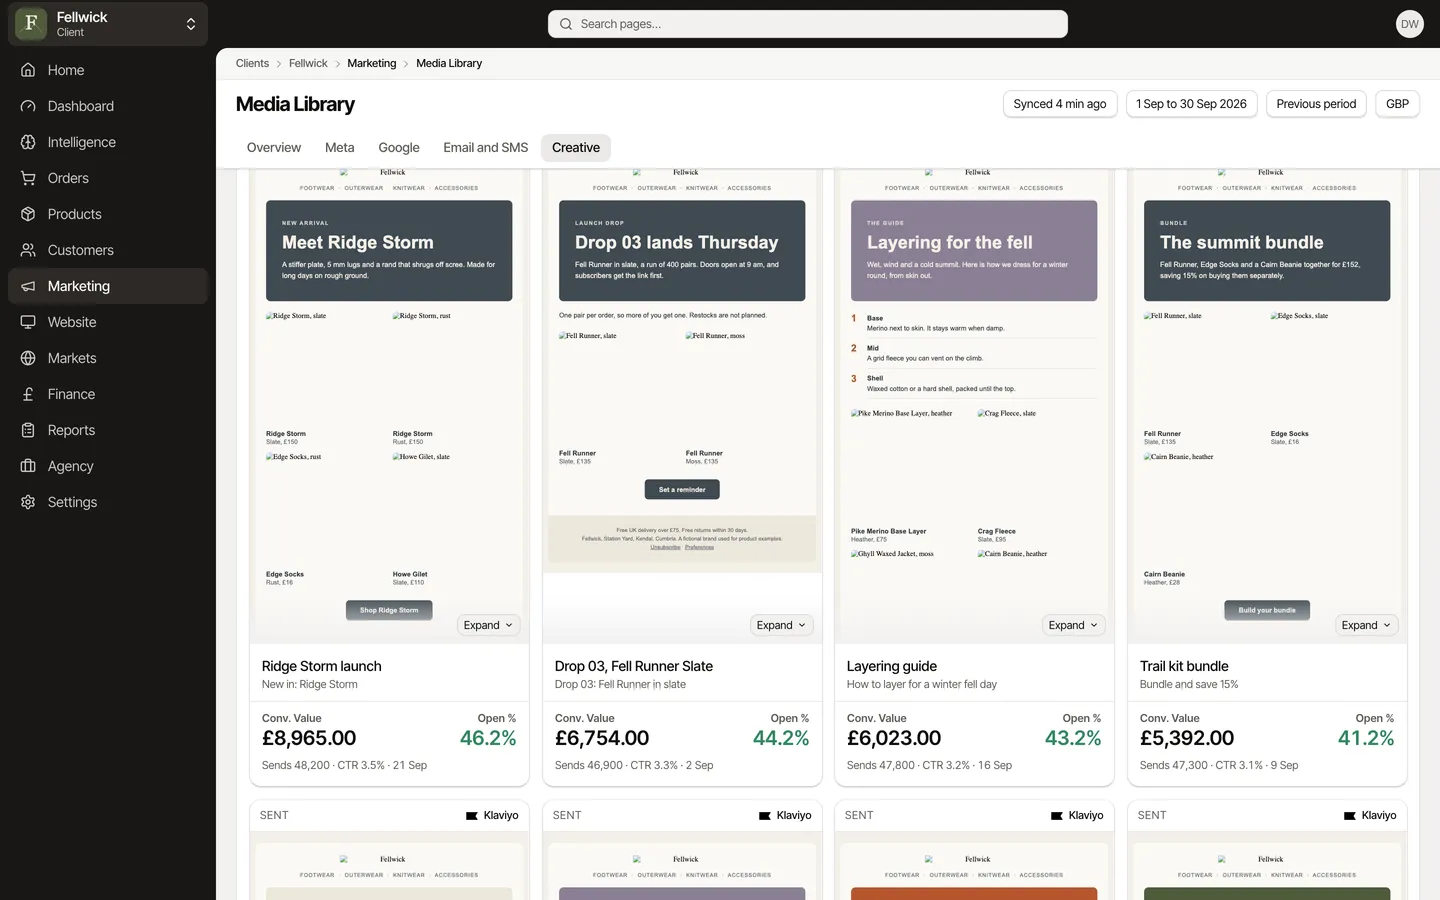
Email
Every Klaviyo campaign as it was sent, with revenue per recipient.

Does it work with our size set-up?
Size views read the Shopify option named Size and normalise the common formats. If yours differ, we check them with you before you rely on them.
Can it separate wholesale and store sales from online?
Yes. The Shopify data filter includes or excludes sales channels and order tags, so the numbers can be web only.